

Is the Stock Market Overvalued? What 1999 Can Teach Us About Today's AI Boom
 Phil Town
In This Article
- Is the Stock Market Overvalued? Market Readings as of October 2026
- Three Numbers That Echo 1999
- Is the Stock Market in a Bubble? Dot-Com Bubble vs. AI Bubble
- Cisco in 1999: A Great Business at the Wrong Price
- What Berkshire's Moves Actually Tell Us
- How to Invest When the Market Is Overvalued
- Is the Stock Market Repeating History?
- Final Thoughts: Stay Rational, Stay Ready
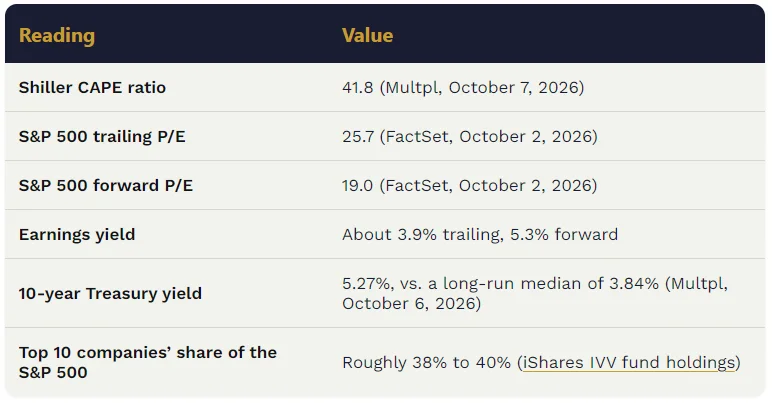
I've been investing for more than 40 years, and right now the numbers are worth taking seriously. For every $100 you put into the S&P 500 today, you're getting back about $3.90 in trailing earnings. A 10-year Treasury, the so-called risk-free rate, pays about $5.30.
So, is the stock market overvalued? By most long-run gauges, yes: the Shiller CAPE ratio is close to its 1999 record, and stocks pay you less than Treasuries on trailing earnings. But the market doesn't have one price, and none of these gauges tells you when anything happens.
I'm not predicting a crash, because nobody can. What I can do is show you the three numbers I'm watching, what 1999 taught us about them, and what I do instead of guessing.
I walked through all of this in my video, "The S&P 500 Hasn't Seen This Since 1999."

Is the Stock Market Overvalued? Market Readings as of October 2026
These numbers move every day, so here’s where they sat when I wrote this.
Three Numbers That Echo 1999
Each of these gauges has a 1999 echo, and each one has a limit. Here's what they tell you, and what they don't.
The Shiller CAPE Ratio: What It Does and Doesn't Tell You
CAPE is the price of the S&P 500 divided by the average of the last 10 years of inflation-adjusted earnings. Using 10 years means one monster year or one awful year can't fool you. It comes from Robert Shiller, a Nobel-winning economist.
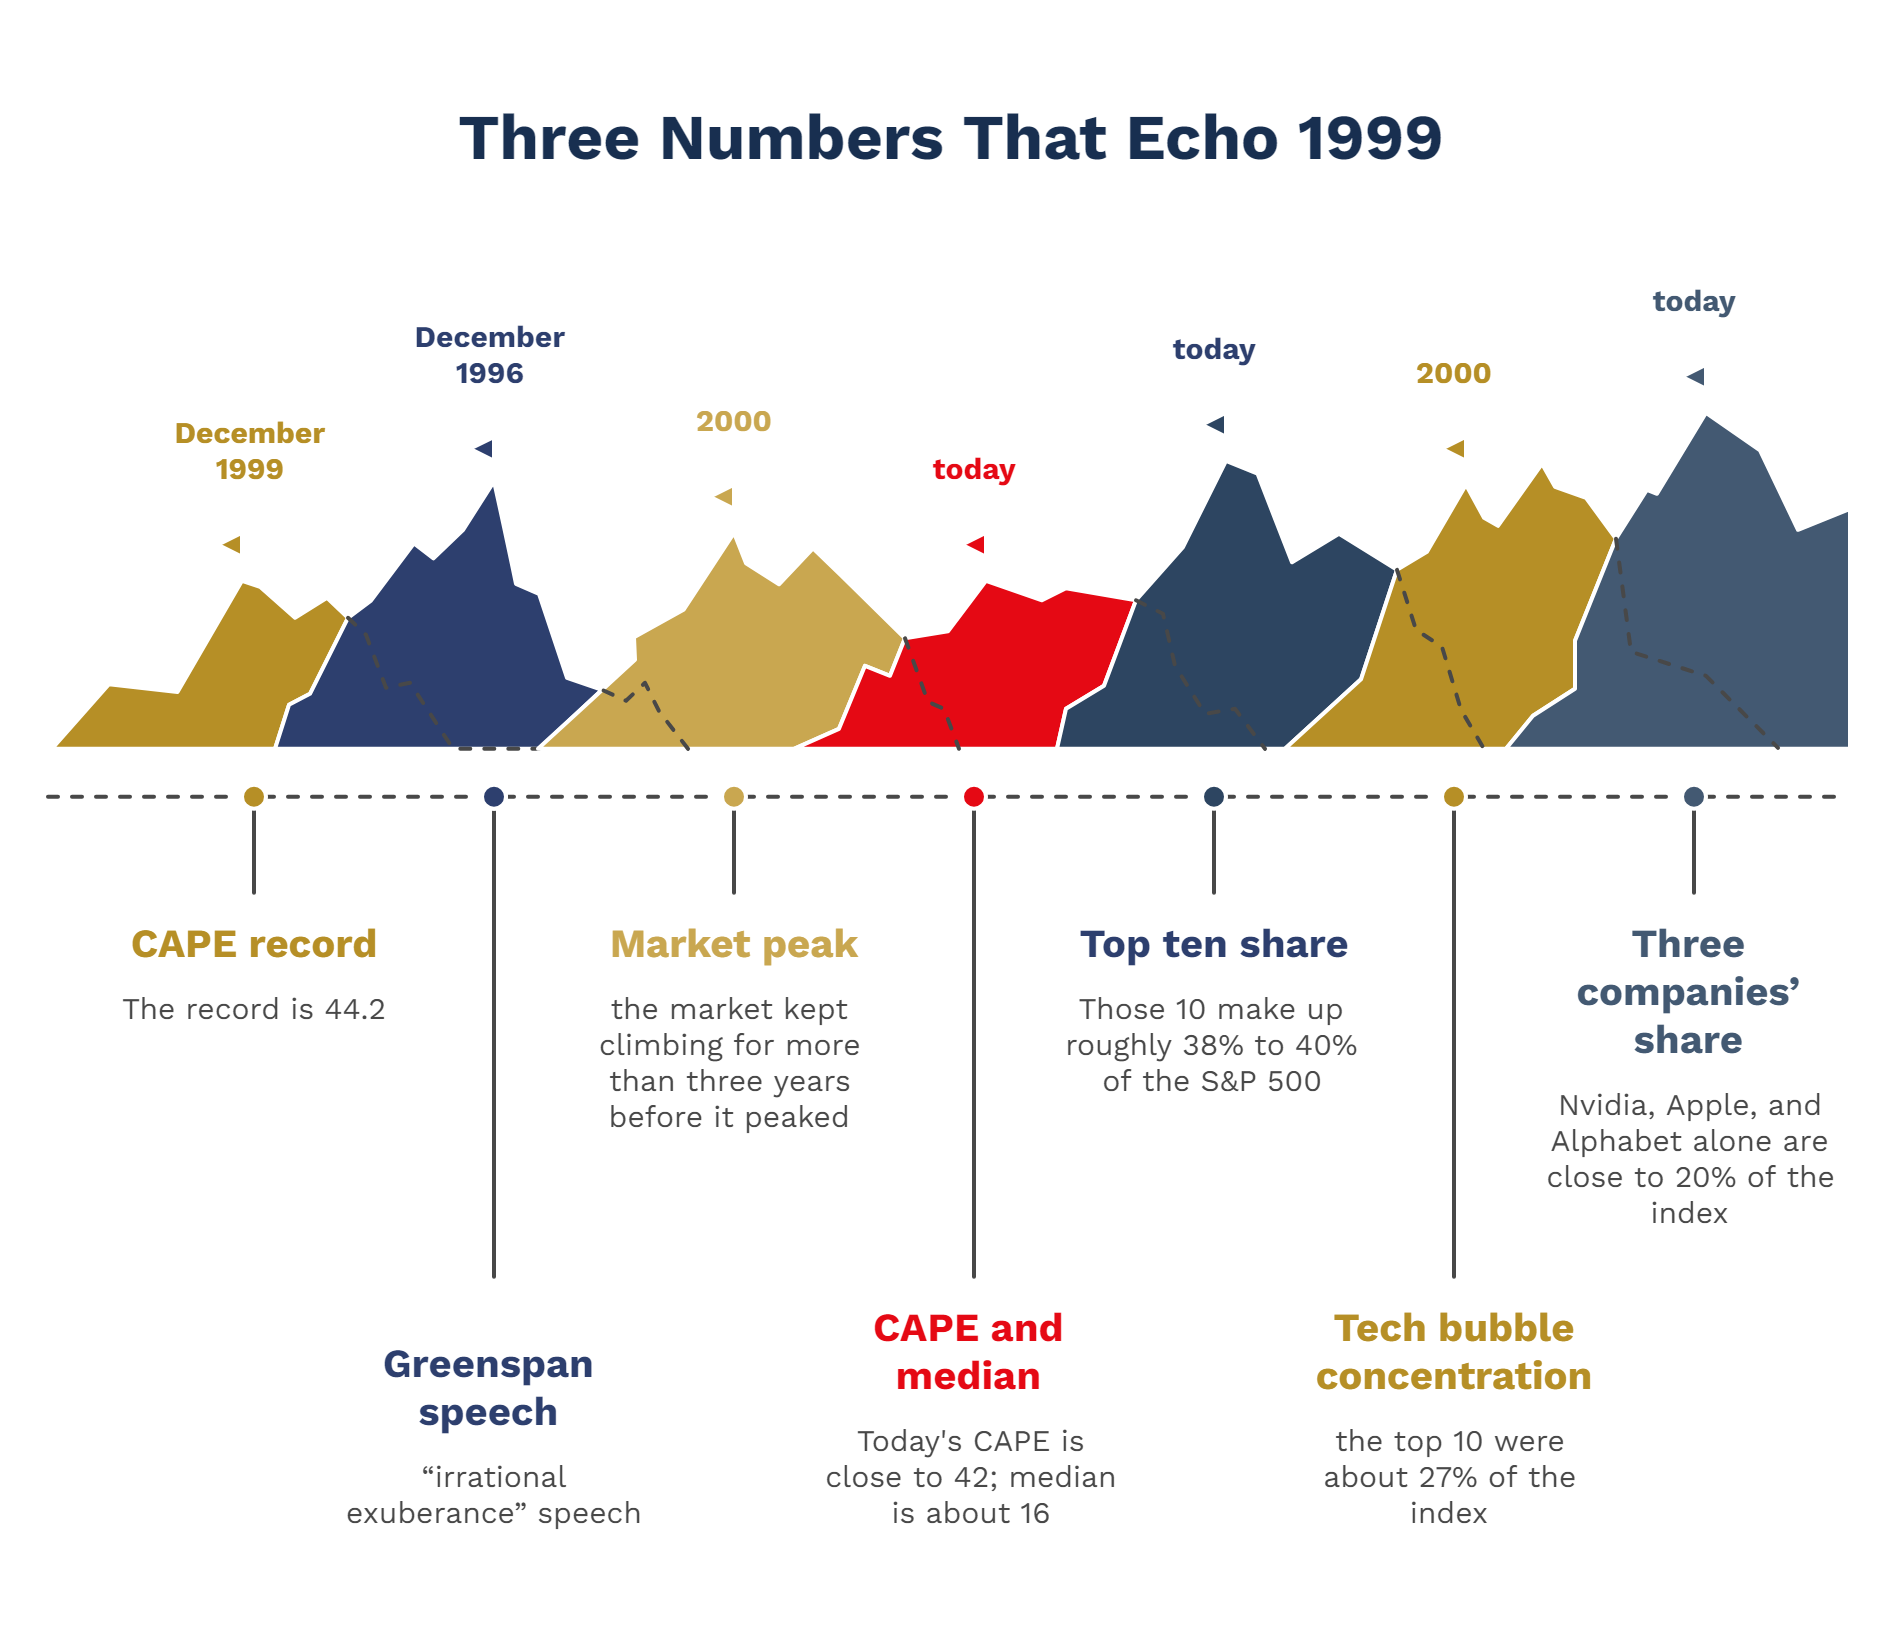
Today's CAPE is close to 42. The record is 44.2, set in December 1999, and the long-run median is about 16, per the same Multpl data. On this gauge, we're a lot closer to the 1999 peak than to normal.
Here's what CAPE doesn't tell you: when. Alan Greenspan gave his "irrational exuberance" speech in December 1996, and the market kept climbing for more than three years before it peaked in 2000. Being early can feel exactly like being wrong.
So CAPE tells you what you’re being paid to own stocks, not what Mr. Market, Ben Graham’s moody business partner who names a new price every day, will do next. Nobody can forecast the next shock, which is why I’ve written about black swan investing.
S&P 500 Concentration: The Market Is Really About 10 Companies
When people say "the market" is expensive, they're mostly talking about 10 companies. Those 10 make up roughly 38% to 40% of the S&P 500 today. At the peak of the tech bubble in 2000, the top 10 were about 27% of the index (Goldman Sachs Research).
If you own an S&P 500 index fund, you carry that concentration whether you realize it or not. Nvidia, Apple, and Alphabet alone are close to 20% of the index, so a rough patch for any one of them can move the whole thing. Here’s a refresher on how index funds and ETFs work if you own them.
Earnings Yield vs. Treasury Yields: The Equity Risk Premium Problem
The equity risk premium is the extra return you should demand for owning a business instead of lending money to the U.S. government. On trailing earnings, that premium is negative right now: stocks pay you about 3.9%, and Treasuries pay about 5.3%.
On forward estimates, the two are roughly tied, because analysts expect earnings to keep growing fast. This is a rough gauge, not a precise equity risk premium calculation, and I'm not telling you to go buy Treasuries.
Either way you cut it, the cushion for taking stock risk is thin. For buyers at today’s S&P 500 P/E ratio to do well, a lot has to go right. That takes us straight back to Buffett’s Rule No. 1: don’t lose money.
Market Crash Survival Guide
Discover how the proven Rule #1 strategy can help keep your money safe during the next market crash
Is the Stock Market in a Bubble? Dot-Com Bubble vs. AI Bubble
In the late 1990s, investors were convinced the internet would change everything, and they were right. The problem was the price people paid for that story. Plenty of darlings, like Pets.com and Webvan, never built a profitable business and shut down when the money ran out.
When the air came out, the Nasdaq fell more than 78% from its March 2000 peak to its October 2002 low (EBSCO). The S&P 500 fell about 49% from March 2000 to October 2002 (Marotta on Money).
So is today an AI stock market bubble? Some of the behavior sounds familiar, but the dot-com bubble vs. AI bubble comparison breaks down in one big place. Today’s leaders have real revenue and real earnings, though plenty of newer AI companies are a different story, as I covered in why I’m not buying the AI IPO bubble.
In its fiscal fourth quarter, which ended June 30, 2026, Microsoft Cloud revenue was $59.3 billion, up 27%, and Azure grew 43% (Microsoft earnings release). Those are real numbers from a real business.
But the story being true and the price being right are two different questions. Warren Buffett made this point in 1999 with the auto industry: at least 2,000 car makes came and went in the U.S., and only three U.S. carmakers survived (Buffett in Fortune, via Novel Investor). You can spot a world-changing trend and still have no idea who wins.
That’s what a durable moat is for: telling the few from the many.
Cisco in 1999: A Great Business at the Wrong Price
Cisco was a genuinely great business in 1999. It had real customers, real growth, and real profits, and it still does. But at its March 2000 peak, investors valued it at well over 100 times its roughly $2 billion of 1999 earnings (Hedge Fund Alpha).
Then the stock lost most of its value. It took about 25 years for the price to get back to its 2000 high, which finally happened in December 2025 (Tiger Brokers).
The business kept growing the whole time. The stock price had simply paid for years of that growth in advance.
A wonderful business bought at a stupid price is a stupid investment. That's the whole game. A great company and a great investment are two different things, and the gap between them is price.
What Berkshire's Moves Actually Tell Us
Berkshire Hathaway held about $365.5 billion in cash and Treasury bills on June 30, 2026, down from nearly $400 billion at the end of March (Berkshire Q2 10-Q and AP). Greg Abel is CEO now, and Warren Buffett is chairman.
Berkshire was also a net buyer of stocks in the second quarter, with nearly $20 billion in net purchases. Alphabet led the buying, with about 48.1 million shares added, including a $10 billion investment agreed in June (AP). Berkshire also exited Constellation Brands and trimmed Kroger, Nucor, DaVita, and several financial holdings.
So the cash pile is huge, and they're still buying selectively. Read that as pricing businesses one at a time, not as a market call. It's exactly what you and I should be doing.
For more on what that cash pile signals, see my breakdown of Berkshire’s cash pile.
How to Invest When the Market Is Overvalued
So how do you invest when the market is overvalued? The market doesn't have a price. Businesses do.
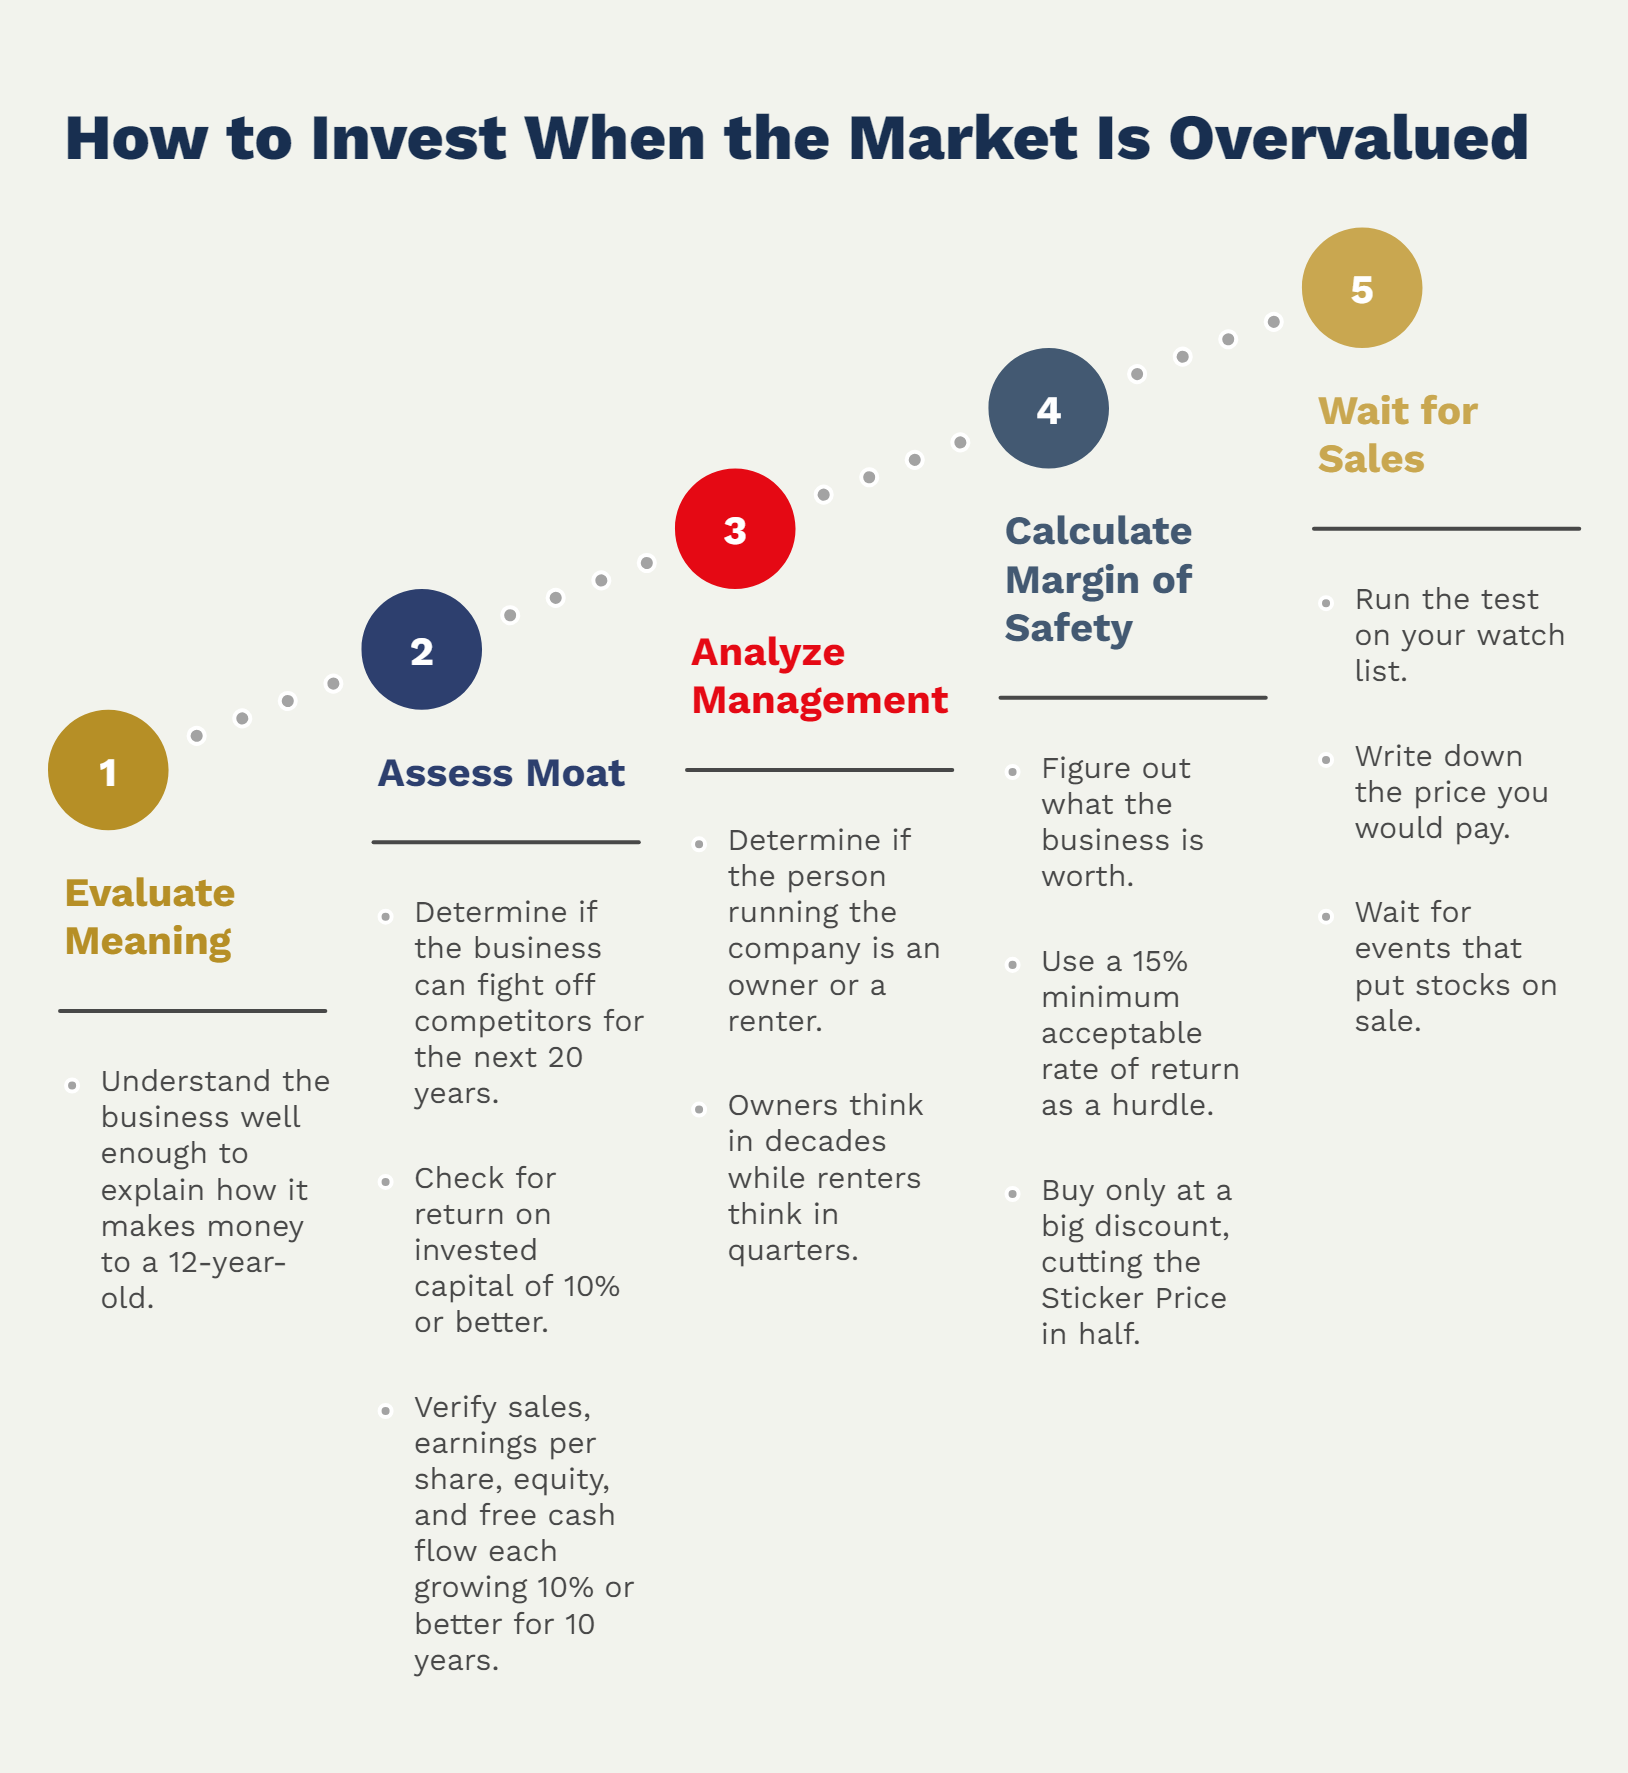
An average is a place where nobody actually lives. So in an expensive market, you shop for individual companies, one at a time, using the Four M’s.
Meaning comes first. Do you understand the business well enough to explain how it makes money to a 12-year-old? If not, it isn’t yours to buy.
Moat asks whether the business can fight off competitors for the next 20 years. The proof shows up in the Big Five Numbers: return on invested capital of 10% or better, plus sales, earnings per share, equity, and free cash flow each growing 10% or better for 10 years.
Management asks whether the person running the company is an owner or a renter. Owners think in decades. Renters think in quarters.
Margin of Safety is where an expensive market gets useful. You figure out what the business is worth, then you only buy at a big discount.
Here's a simple illustration. Say a business earns $10 per share, and you believe it can grow earnings 10% a year for 10 years. That $10 becomes about $25.94, roughly two and a half times what it earns today.
Give it a future P/E of 20, which is twice the growth rate, or its historical high P/E if that's lower. Multiply $25.94 by 20 and you get a future price of about $519.
Now bring it back to today using a 15% minimum acceptable rate of return. That 15% is the hurdle we use in the calculation, not a promised or expected result. At 15%, money doubles roughly every five years, so divide $519 by 4 for a Sticker Price of about $130.
Cut that in half and your Margin of Safety price is about $65. The full method is in my Sticker Price and Margin of Safety guide, and Payback Time gives you a second check on value.
Then run it on your watch list. The Sticker Price and Margin of Safety calculator does the math, and our other investment calculators help you test your growth and P/E assumptions.
Here's the part most people don't like. In an expensive market, most names on your list will fail the test by a mile, and that's the test working. Most of the job is homework, writing down the price you’d pay, and waiting for one of the events that put stocks on sale.
Is the Stock Market Repeating History?
The pattern isn't identical, but it rhymes: an expensive index, heavy concentration in a handful of names, and a real technology shift driving the excitement. So is the stock market repeating history? Partly, and the part that repeats is the gap between how good a business is and what people pay for it.
After past bubbles, prices and business values separated sharply, and prepared investors got to buy real businesses at sensible prices. Markets do fall sometimes, and when they do, hope won’t hold your hand. Knowing what you own and what it’s worth will.
If you’re new to this way of thinking, start with the Rule One strategy overview.
Final Thoughts: Stay Rational, Stay Ready
Is the stock market in a bubble? Maybe, but you don't need to know that to invest well. Know the gauges without trying to time them, price businesses one at a time, and demand a Margin of Safety, then wait with a watch list and a price in mind.
I’m a three-time New York Times bestselling author, including one book I co-wrote with my daughter, Danielle, and I manage a hedge fund. Tens of thousands of people have learned this method in our workshops. Mr. Market’s mood changes, but the discipline doesn’t.
The better question is whether you'll be ready when Mr. Market puts wonderful businesses on sale. If you want to learn how to run the Four M's and value a business yourself, join me at the Virtual Investing Workshop.
Now go play.
Rule One Investing provides investment education and training only. We don't provide personalized investment advice, manage client assets, or guarantee investment returns. All content is for informational purposes. Consult a qualified financial professional before investing. Past performance doesn't guarantee future results. Individual results vary.
About Phil Town
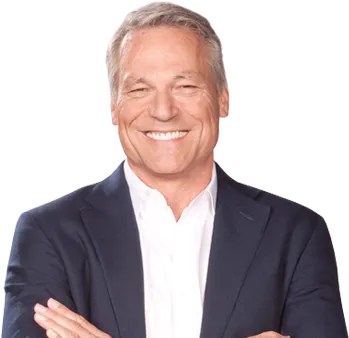
Phil Town is an investment advisor, hedge fund manager, 3x NY Times Best-Selling Author, ex-Grand Canyon river guide, and former Lieutenant in the US Army Special Forces.
He and his wife, Melissa, share a passion for horses, polo, and eventing. Phil's goal is to help you learn how to invest and achieve financial independence.
Get Phil's Free Guide