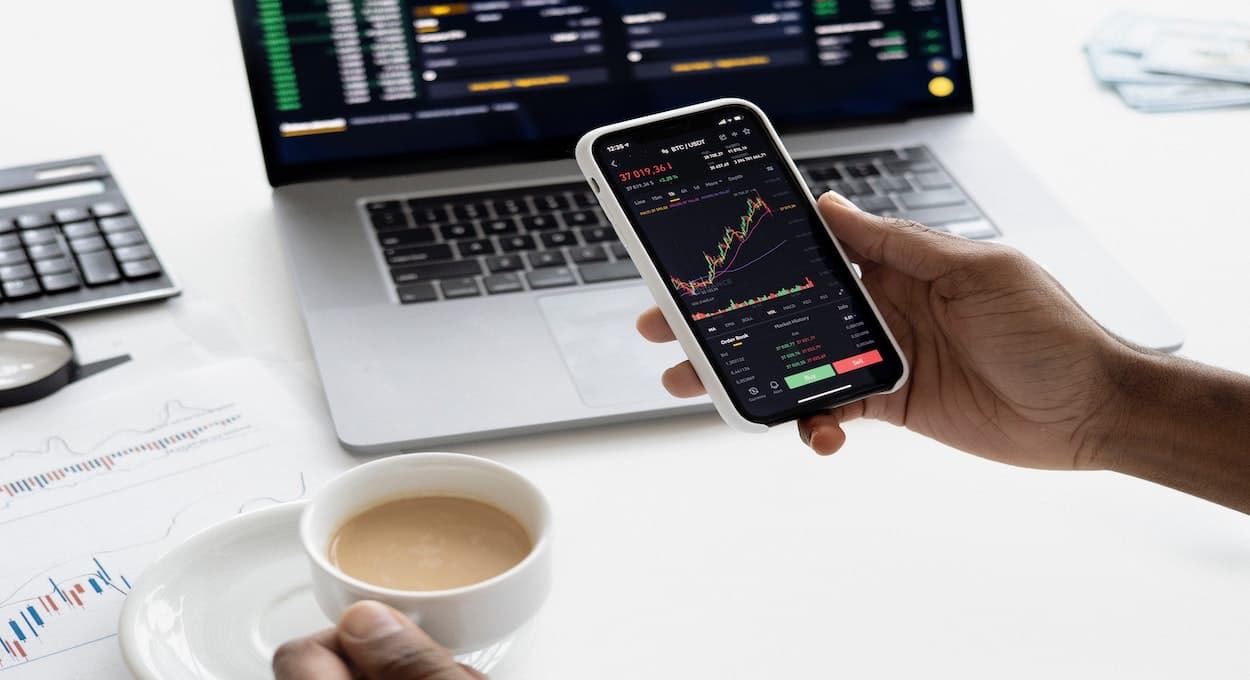

Danielle and I are coming to you live from New York in the HarperCollins studio for the last time today and we are discussing the current market. Tune in as we review the key market indicators both Phil and Danielle use to make their investing decisions.
Watch on Facebook:
In Episode 156 You’ll Learn About:
The Buffett Indicator
The Buffett Indicator is the ratio of a country's stock market capitalization to the overall GDP of the country
Read more on page 95 of Invested
It is a fundamental indicator based on real numbers based on price and sales happening in the market.
Shiller PE (Cape) Ratio
Stands for: Cyclically-Adjusted-Price-to-Earnings
Around 16 is Reasonable.
In the mid 20’s range is where you should start to get nervous.
When it hits anywhere in the 30’s it becomes an unchartered territory and has only happened 3 times in history: 1920’s, 2000’s, and now currently where it is at - 32.
Interest Rates
They are currently artificially low which gets people to spend money and stimulate the economy, which then turns into jobs. Then, labor rates go up which increases wages then prices go up. This is called an inflation cycle.
Buffett & Munger’s Actions
Buffett hasn’t bought anything in 2 years which is him telling us that he believes there is nothing priced fairly in the market currently.
Why are professional investors not getting the same great returns other Rule #1 Investors can get?
Professionals simply tend to shadow the market for the short term, their investors do not have the patience for a long-term strategy. They simply shadow the market
Show Notes:
Buy Invested