
I've been mentoring Major Clay Edens about getting him the money he needs to retire comfortably in a few years. His goal is to buy a 42' boat and travel the Caribbean islands. He's started doing his homework by practicing the 4M's and taking a look at my WFMI posts. But he still had a few questions about identifying a wonderful company. Read on to learn where WFMI is today, and how I as a Rule #1 investor interpret its position. For those of you who need visuals, there are charts and graphs with this post.
Phil,
As you will see with some of my figures I did have some trouble, but I am hoping that based on your experience and familiarity with WFMI, you will be able to quickly identify them. I used your Blog to try and build a YUMMMY report with enough detail to show myself I had the ability, I was confused as to where to find the information for the MOAT, and doing the calculations for the MOS.
Clayton
Here's my response.
Hi Clay,
I attached a few charts I built for you. Let's start with WFMI. One is a view of growth using dollars and the other is growth using growth rates. (Click on them to see a larger view.)
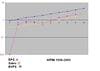
Fig. 1: (left) WFMI Growth using growth rates. Fig. 2: (right) WFMI Growth using dollars.
You can see that in absolute dollar terms WFMI has beautifully consistent growth. But when we look at growth rates EPS gets bouncy. Looking for a consistently growing business means we take the long view, and sometimes looking at a picture is worth a thousand words. I look at these charts and see a really well run business unfolding.
(Of course I also know the business and know that, for example, a single competitor has 2400 stores while WFMI has only opened 170 or so -- so my research tells me it probably has some more growing to do.)
Now let's look at the charts of an established business: WAG (Walgreen's). WAG's growth over 25 years is completely consistent and predictable -- so if we were grading a business on a scale of 1 to 4, WAG is a 4.0.
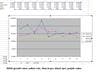
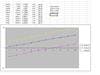
Fig. 3: (left) WAG Growth using growth rates.Fig. 4: (right) WAG Growth using dollars.
Now compare WFMI, above, to what a perfect 4.0 looks like. They look a lot alike -- with the exception of the beginning years of WFMI. But since WAG is a very old business and WFMI is very new, I'd cut WFMI some slack and put it upward of 3.9 overall in terms of consistency.
However, we can't just take the numbers out of context. We have to look at the Moat itself. Personally, I think WFMI is building a huge brand moat based on the quality of the environment, product and in particular the people. I like their brand better for the future than even WAG. So I'm happy with the 3.9 grade for consistency; because of the big moat they are building, that will protect them and make these consistent numbers even more consistent in the future.
Also I have to take into consideration the guy who runs it. I think he's a frick'n genius with the right business combination of heart for the BAG (Big Audacious Goal) and employees, and mind for the business operations. He's a full Level Five CEO. That also makes me happy with my consistency grade.
So then we take this to the numbers...
The safest way to eval a biz is to use the lower of historical growth or analysts' prediction. With WFMI the analysts have lowered their predictions significantly in the last year from about 20% to 15%. They are playing it very safe.
Using that number and their current TTM EPS of $1.52, using the Rule of 72 we would grow the buck fifty to $3, then to $6 -- because 15% growth is two doubles in ten years. A 15% growth rate is going to result in a 30 PE by default (2x growth) unless the historical PE is lower -- which it isn't.
So 30 (PE) x 6 (Future EPS) is $180. That's the value of WFMI in ten years. Which makes today's value one quarter of that - $45. YEouwwww.....! It's selling for $154! Seems it's time to run for the hills. And if you are just beginning to look at WFMI and are new to investing, definitely run!
But let's take a different look, one that is just a bit more sophisticated. First, what is the real long term growth rate of WFMI? The analysts average it at 15% with the highest at 19%. On the other hand, the CEO, Mackey, just RAISED the company sales goal up 20% by the year 2010, and the old goal had them on a growth rate of 20% a year. So in a sense, he's upped the game to 24% growth.
Second, the equity or book value growth rate for ten years is 20% but accelerating: the five year average is 28%, the three year average is 25%, and last year's average is 27%. And we know that the growth rate of equity in a business is the single best proxy for long term growth of value of the business.
What that means is that if the business is priced at or below its real value or sticker price, it should grow at a 20% plus clip into the future if its market can handle the growth... and I think America and the world are begging for more Whole Foods stores. That makes it really hard for me to believe in the 15% growth rate the analysts are using. I'm going to stick to my guns on this one and keep the growth rate where I put it a year ago - 22%.
And I'm going to ignore a bad TTM EPS and use the EPS they had last year - 2.35. That means I'm doubling a bit more than three years, or right at 3 times in ten years. So one double is 4.70, the second double is 9.40 and the third is 18.80. Times some reasonable PE for WFMI - historical works or the default - 40 or 44. Use 40 and we get a future price of $752 and a sticker today of a quarter of that (for our preferred 15% ROI) - $188. And that keeps me in this business.
But what if I'm wrong and the analysts are right? What if the sticker today really is $45?
Well, thank God for good Tools! If I'm wrong, what will happen is that the rest of the market will eventually correctly price this business at about $45. To do so the big guys have to sell. Since they can't just run out and dump it in a big panic like I can, they will slowly sell off more and more of their position. That will put "get out" signs all over the WFMI chart. And I'll get out.
What will follow for me will be a long period of sideways trades with an occasional bump up. I did this for a couple of years in Microsoft until I finally gave up on its future growth rate. During that time the stock went from $55 to the mid $20's and I did not violate Rule #1. In fact, since it was bouncing around quite a bit in the first couple of years of the drop, it did quite well in spite of the drop. But once it started trading in a range, it was over and I had to re-evaluate... Which meant putting my money in something else that was more clearly undervalued.
So where does that leave us right now with WFMI? Nervous, I would say. For two reasons. Conservative projections of growth make this overvalued, and my own more optimistic evaluation puts the current price in the red zone anyway - the time when the price is within 20% of the sticker. $154 is 82% of sticker price. So it's already in the danger zone and the analysts are lowering expectations. Time to be very watchful of WFMI, my friend.
So, Clay, that's what's going on in my head as I'm looking at this right now. I'm watchful and alert and ready for an ambush. Flankers are out. Time to move very carefully. See if we can sneak on through this place. And if we can't we are ready to rock 'n roll and run like hell!
Now go play!